ArchiMate Graph Explorer
The ArchiMate Graph Explorer is a web application which renders an interactive force directed graph of an ArchiMate model.
TL;DR - Jump straight to the demo
Note: The ArchiSurance Case Study has been included as an example model.
Background
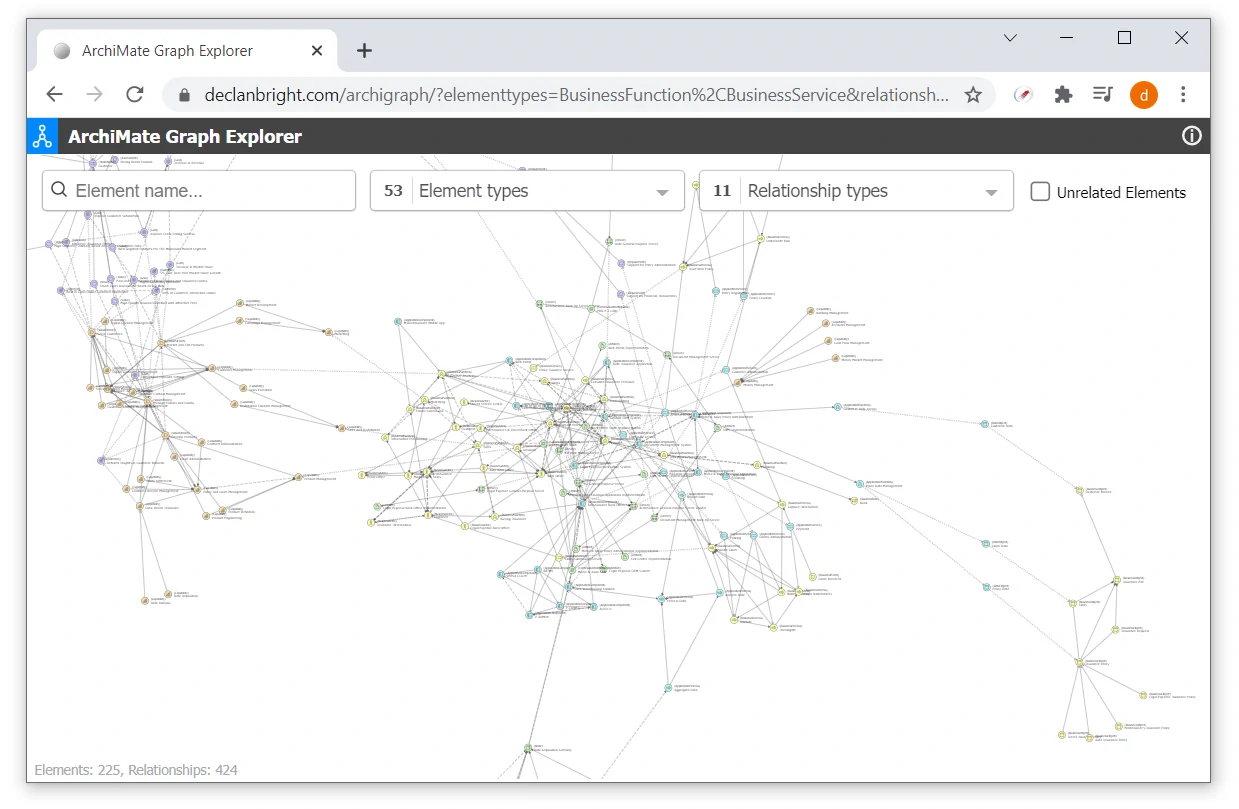
The objective of the ArchiMate Graph Explorer is to provide an alternative way of browsing and exploring an ArchiMate model in a web browser.
The underlying structure of an ArchiMate model is a graph data structure, with elements (nodes/vertices) and relationships (links/edges) connected together. Creating visualisations of graph data structures can be fun and D3.js is a great JavaScript library for creating this type of data visualisation.
The Archi tool has a built-in "Visualier" feature which will display a graph visualisation from the perspective of the selected element with a breadth first search of the related elements. It also has options for depth and filters by element type, relationship type etc. This is really useful in the context of a single element but there are other ways you might want to search and browse the model graph.
How it works
The ArchiMate Graph Explorer web application is relatively simple, there are no fancy build systems, no transpilers, no endless list of dependencies, just some vanilla JavaScript (ES6 modules) and a few libraries; D3.js for generating the force directed graph visualisation, tail.select.js for some nice multi-select downdown lists, autoComplete.js for an auto-complete search box and some CSS.
It can read a model from an ArchiMate Model Exchange Format file or the native file format from Archi. Most major ArchiMate tools support the exchange format so this application should work with models from any of those tools, however it has only been tested with files created by Archi. The model data is loaded into a D3.js force simulation and rendered using SVG. Conditional styling is applied to the elements and relationships so they have the familiar ArchiMate icons, colours, arrowheads etc.
The UI is designed with the mobile first approach so that it works on various screens sizes; from smartphones to large desktop monitors. It supports touch, pinch zoom, pan and the elements can be dragged around to rearrange them to fixed positions.
The application has been developed using ES6 therefore it only works with modern browsers such as Chrome and MS Edge.
Search/Filter Modes
The application supports two primary modes of searching & filtering; flat filtering and breadth first search.
Flat Filtering
If a root element has not been selected, filters can be applied across all elements and relationships in the model. An "Unrelated Elements" checkbox is available in this mode, checking it will display elements that do not have any relationships to other elements (depending on the selections in the "Element types" & "Relationship types" filters).
Breadth First Search
Similar to the Visualiser in Archi, a breadth first search can be performed from a selected root element. You can either use the "Element name" search box to search for an element or double-click on an element to set it as the root element. A "Depth" filter is available in this mode. Clear the "Element name" search box to return to flat filtering mode.
Deep Linking
When a root element is selected, its "elementid" is appended to the URL querystring. Other filter values are not automatically appended to the querystring due to the potential excessive length if most or all filter values were selected, however, they can be specified manually, e.g.
- Root Element: Customer | Element Types: All | Relationship Types: All | Depth: 2
- Root Element: ArchiSurance WAN - Element Types: Communication Network, Device, Node - Relationship Types: All - Depth: 2
- Element Types: Driver, Goal, Stakeholder, Value - Relationship Types: All
Using the Graph Explorer
So, what is the application useful for you might ask? First of all, it allows you to see a broader view of a model, to see all of it at once if you want to. While this can be interesting, it starts to become more useful as you filter by the various element and relationship types to examine how the model is linked together.
As you explore, you will probably find gaps and mistakes in your model, such as missing relationships i.e. elements or clusters of elements that don't link to anything else or Application Services which don't have any Serving relationships to other Application Services or Business Services/Processes/Functions, or where a Trigger relationship was used by mistake, instead of a Serving relationship etc.
You can use this application with your own ArchiModel model by exporting it to an exchange format file. You can either download the source code and host the application yourself (configure the path to the model file in settings.js) or you can load it into this ArchiMate Graph Explorer by clicking on the settings (gear) icon, and dropping your model file into the drop zone. Your model will not be uploaded to a remote server, it will only be loaded directly into your web browser's session storage. You can delete it at any time by closing your browser tab.
It's a nice simple interface that can be shared with colleagues, just like the web report from Archi, allowing others to explore your model via a web browser without needing to install any additional tools.
Additional Features
Custom properties can be added to the elements of an ArchiMate model and these can be used in interesting ways. The graph explorer has some optional features that can be enabled to utilise custom element properties.
Lifecycle Status Filter
A lifecycle Status property is a useful way to identify Current state, Future state and Deprecated elements in a model. The status values only have to be set for non-Current elements, everything else is assumed to be "Current" state. The values in the Element Status dropdown list filter can be configured in the settings.js file.
Stereotype Label
Adding a Stereotype property to elements is a really useful way to improve the understandability of you model. This is covered in more detail in the Archi Tips and Tricks page. A label which displays the stereotype property (inside guillemet characters) beside each element can be enabled/disabled by a flag in the settings.js file.
Data Classification Styling
It's imperative to have a solid understanding of data classification to effectively manage data privacy across an organisation. A DataClassificationLevel property can be used to label data objects with the appropriate classification. A common approach is to use TLP; Red, Amber & Green. This feature uses the DataClassificationLevel property to set the colour of the nodes based on a configurable colour map, which is useful to highlight how sensitive data is managed across the architecture. This feature can be configured in the settings.js file.
Source Code
The source code is available on GitHub: